Grant Gager, City Manager
406-823-6000
07 May COVID-19 Update BioBot Estimated Cases
Let’s get started with Day 4 of our informational series on COVID-19 in Montana! This is the last day we’ll introduce a new chart, but tomorrow will be our Facebook Live event to answer any questions you may have on the information we’ve provided. If you can’t make the event and want to have a question answered for later viewing, please send us an email at fkinnick@livingstonmontana.org.
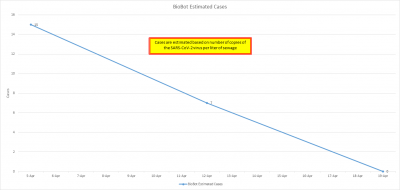
Today’s chart shows the results from the BioBot analysis of our sewage, or wastewater. Let’s start with some background on what this test actually does. Our wastewater operators collect a representative sample of wastewater over a 24-hour period. This sample is sent off for lab analysis of the SARS-CoV-2 virus, which is the virus that causes COVID-19, or Coronavirus Disease – 19. The analysis detects the number of copies of the live virus in the sample and uses that number to estimate how many people with active cases are using the wastewater system. Immediately you can see some limitations with this testing. First, it only measures the virus from people that are connected to the Livingston wastewater system. It does not capture cases from people who live outside of the city unless they use facilities in the city when visiting. Second, the estimate of active cases is based on a baseline wastewater system of a large Northeastern city. That can introduce some uncertainty as to whether their active case numbers were accurate if a small city exhibits similar traits as a larger one, and if differences in climate could affect results. Additionally, the shipping and lab analysis takes time so it can be over a week to get the results back from the lab. Despite these limitations, there is still some information that is extremely useful from the reports.
The data points for lab analysis are only once a week, so they are snapshots that show trends. The more data points we get, the better for comparison’s sake. Our first data point on 05 April estimated 15 active cases on our wastewater system. This is much higher than the total number of confirmed cases in Park County, which stand at eight (8). This could be due to asymptomatic cases that did not get tested; it could be a function of an error in estimating the exact number of cases, or it could be a combination of those factors. In the end, the reason isn’t important because the intent is not to pinpoint the number of cases but to show the trend of increasing or decreasing cases within the city. To that end, our next estimate of seven (7) cases on 12 April and then zero (0) cases on 19 Apr agree with our testing data that the cases in Park County were decreasing over this time frame. The 19 April test indicated that the lab did not find any SARS-CoV-2 virus in the sample at all.
While this data is positive at this point, the ability to have some form of data on visitors to the community is what makes it unique. As the tourist season begins in whatever form it will take this year, this testing will help show roughly how much of the virus is being brought into the community by visitors. Assuming most local cases will be identified, differences in the virus level should correlate loosely to the amount brought in by visitors, even if they are just stopping for gas on the way to the Park. While the data isn’t precise, it will help us see the exposure and the risk the community faces as we continue our journey towards normalcy. Unfortunately, the cost of this information is significant. Over the course of the next year, it requires we budget for $50,000 to $60,000 for testing. This cost will be borne by the Sewer Fund if there is not a mechanism to be reimbursed by State or Federal agencies. Despite the cost, the information provides one of the few ways to quantify the impact of tourism on the COVID-19 situation in the county.
I hope you have enjoyed our series this week and we look forward to answering any of your questions during our Facebook Live event tomorrow, Friday 7 May at 11:00. Send in those questions and we’ll talk to you tomorrow!

